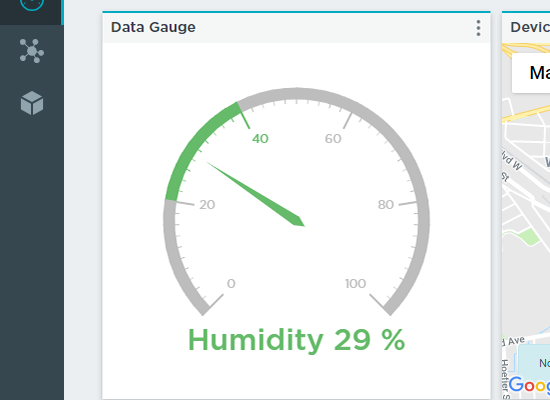
Data Gauge Widget
The data gauge widget adds a gauge to the Dashboard that displays the value of a single dataset for a device within a gauge. The gauge is divided into a start, middle, and end segment, with each segment being configurable.
Settings
The data gauge widget includes the following configurable settings:
Title
The title displayed on the widget’s menu bar.
Prefix
The label associated with the gauge data.
Units
The units of the data displayed on the gauge.
Number of Decimal Places
Maximum number of decimal places that will be displayed for the data value beyond its decimal point.
Min
The gauge’s minimum value.
Max
The gauge’s maximum value.
Number of Splits
Number of incremental values displayed on the gauge (not counting the min value).
Middle Segment Start
Value on the gauge where the middle segment starts. If this value is less than the gauge’s minimum value, the start segment won’t be shown.
Middle Segment End
Value on the gauge where the middle segment ends. If this value is greater than the gauge’s maximum value, the end segment won’t be shown.
Start Segment Color
Color of the gauge’s starting segment.
Middle Segment Color
Color of the gauge’s middle segment.
End Segment Color
Color of the gauge’s ending segment.
Update Interval
The speed the widget refreshes its data.
Data Source
The device and data the widget is configured for. Click Select to enter the following configuration options for the widget:
- Device: The device the widget is based on.
- Cloud Storage: The cloud storage element storing the device’s data.
- Value: The dataset to display on the widget.
Once the data configuration is set, click Confirm.
