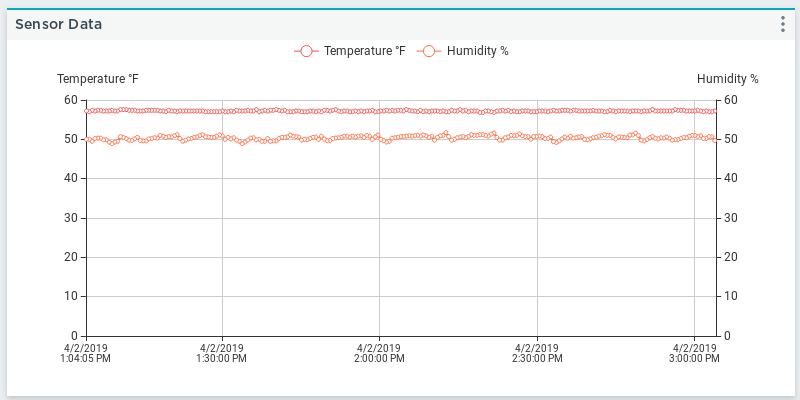
Data Graph Widget
The data graph widget adds a graph to the Dashboard that plots a device’s data.
Settings
The data graph widget includes the following configurable settings:
Title
The title displayed on the widget’s menu bar.
Update Interval
The speed the widget refreshes its data.
Data Source
The device and data the widget is configured for. Click Select to enter the following configuration options for the widget:
- Device: The device the widget is based on.
- Cloud Storage: The cloud storage element storing the device’s data.
- X-axis Value: The dataset to display along the graph’s x-axis.
- Y-axis Value: The dataset to display along the graph’s y-axis. You can select up to five values for the y-axis.
Once the data configuration is set, click Confirm.
Time Range
The data graph widget includes the following configurable time range settings:
Date Range
The timeframe used to update the graph’s data. This field includes the following options:
Last 10 Minutes(default)Last HourLast 2 HoursLast 6 HoursLast 12 HoursLast 24 HoursLast 7 DaysLast 30 DaysCustom Range
Custom Range
The custom dates set to establish the graph’s range. This field is available if the Date Range field is set to Custom Range.
Clicking this field displays a calendar that allows you to select the beginning and end date and time for the graph’s range. Alternatively you can manually enter the data range in the field. Once a start date and end date are selected on the calendar, click Apply to update the range.
To manually enter a custom range, use the same format (DD/MM/YYYY - DD/MM/YYYY) as is displayed in the field by default. If the range format deviates from this structure, the range won't work.
Bounds
The data graph includes configurable bound fields to set its y-axis minimum and maximum values. Any y-axis dataset in the graph is included here to set its bound values.
